Garmin Vector vs Stages Power: absolute accuracy comparison
I’ve spent last few years competing against my cycling buddy Roberto. He is objectively stronger than me, but the real question always was - how good am I at closing the gap in our cycling abilities?
The winter months were the times, when we would be training indoor and track each others progress only via power numbers published on Strava. It was always quite discouraging to see that the numbers from Roberto were regularly 20-30 Watts higher than mine.
On those occasions when weather was permitting we would go outside shoulder-to-shoulder on the open roads and observe that the power difference hardly translated into the difference in speed.
We are both the same size, the same weight, riding similarly priced bikes (bloody expensive according to our wives) and collecting power numbers from the Garmin Vector units. Given that back then we were both living in the pancake flat Netherlands, this power discrepancy at the same speed was leaving us scratching our heads in disbelief.
When one starts training with a power meter it is impossible to go back so it was only a matter of time before I bough a second power meter for my winter/commute bike. I’ve opted for Stages power this time and this gave me a unique opportunity to compare power readings from both devices head to head.
Setting up experiment
I’ve installed both power meters on my aluminum Wilier La Triestina bike equipped with Shimano Ultegra 6700 2013 groupset. The bike was mounted on the Tacx Flow turbo trainer. The power from the Stages was collected using Garmin Edge 520. The power from the Vector was transmitted to Garmin Edge 800. Both streams were using ANT+ protocol.
I’ve executed simple ramp test with increasing power from 200 to 350 Watts each minute with a step of 25 Watts.
For data processing I’ve used directly .fit files and pandas powered python script. Both data streams were synchronized in time and spurious readings like power drops or cadence spikes were removed from analysis.
I’ve also used balance information from Vector to report the power as 2xLeft in order to match it with readings from Stages. The latter provides only single sided data.
Comparing absolute accuracy of Garmin Vector to Stages Power
Results of the experiment are on the graph below. Power readings from Stages and Vector are shown in black and blue respectively. While power difference is shown in red. The scatter dots represent data collected with sampling rate 1 sample/sec, while the lines are the result of applying moving average filter with duration 3 sec. The latter is the same settings as I use on the Garmin Edge units.
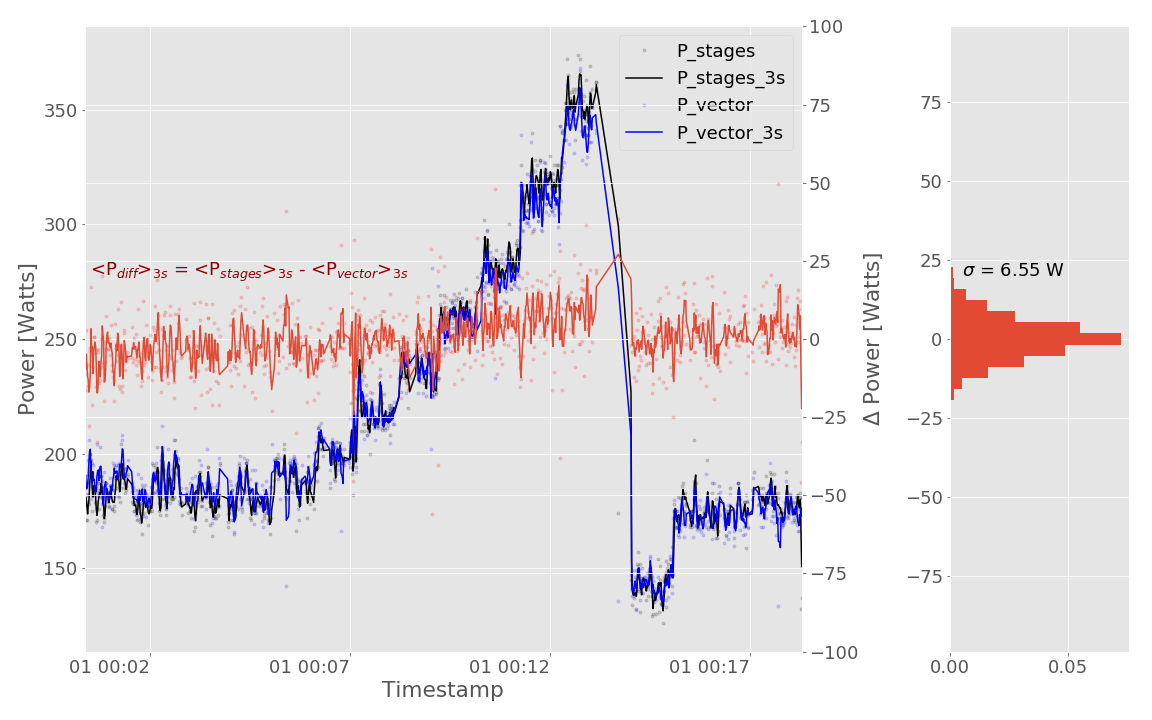
I think it is fair to say that the power readings are matched very well. The distribution of the power difference is well centered around zero and standard deviation of 6.55 Watts amounts to only 2.6% of the average power 250 Watts - quite within the promised precision of both devices, not to mention that the noise adds quadratically.
So what?
This simple experiment did not help me to unravel the mystery of power difference between me and Roberto but left me with enough confidence to easily switch between my two bicycles.
On the other hand it is worth mentioning that the more elaborate studies claim that the absolute accuracy of different power meters can vary as much as by 5%.
I might be just lucky with mine.