Using Machine Learning to Separate Workouts from Commutes
When I’ve moved to the Netherlands almost 15 years ago I’ve adopted bicycle as a primary mode of transportation. Even after relocating to Brussels I did not give up on it and bring my children to school, do the groceries and commute to work exclusively by bike. Basically I have no idea which tram would bring me from my house to the Manneken Pis.
Am I a special one? Not at all. In the Netherlands and Belgium many people do the same and this creates very peculiar problem for those, who uses cycling not only for commute, but practice it as a sport.
Luxury problem
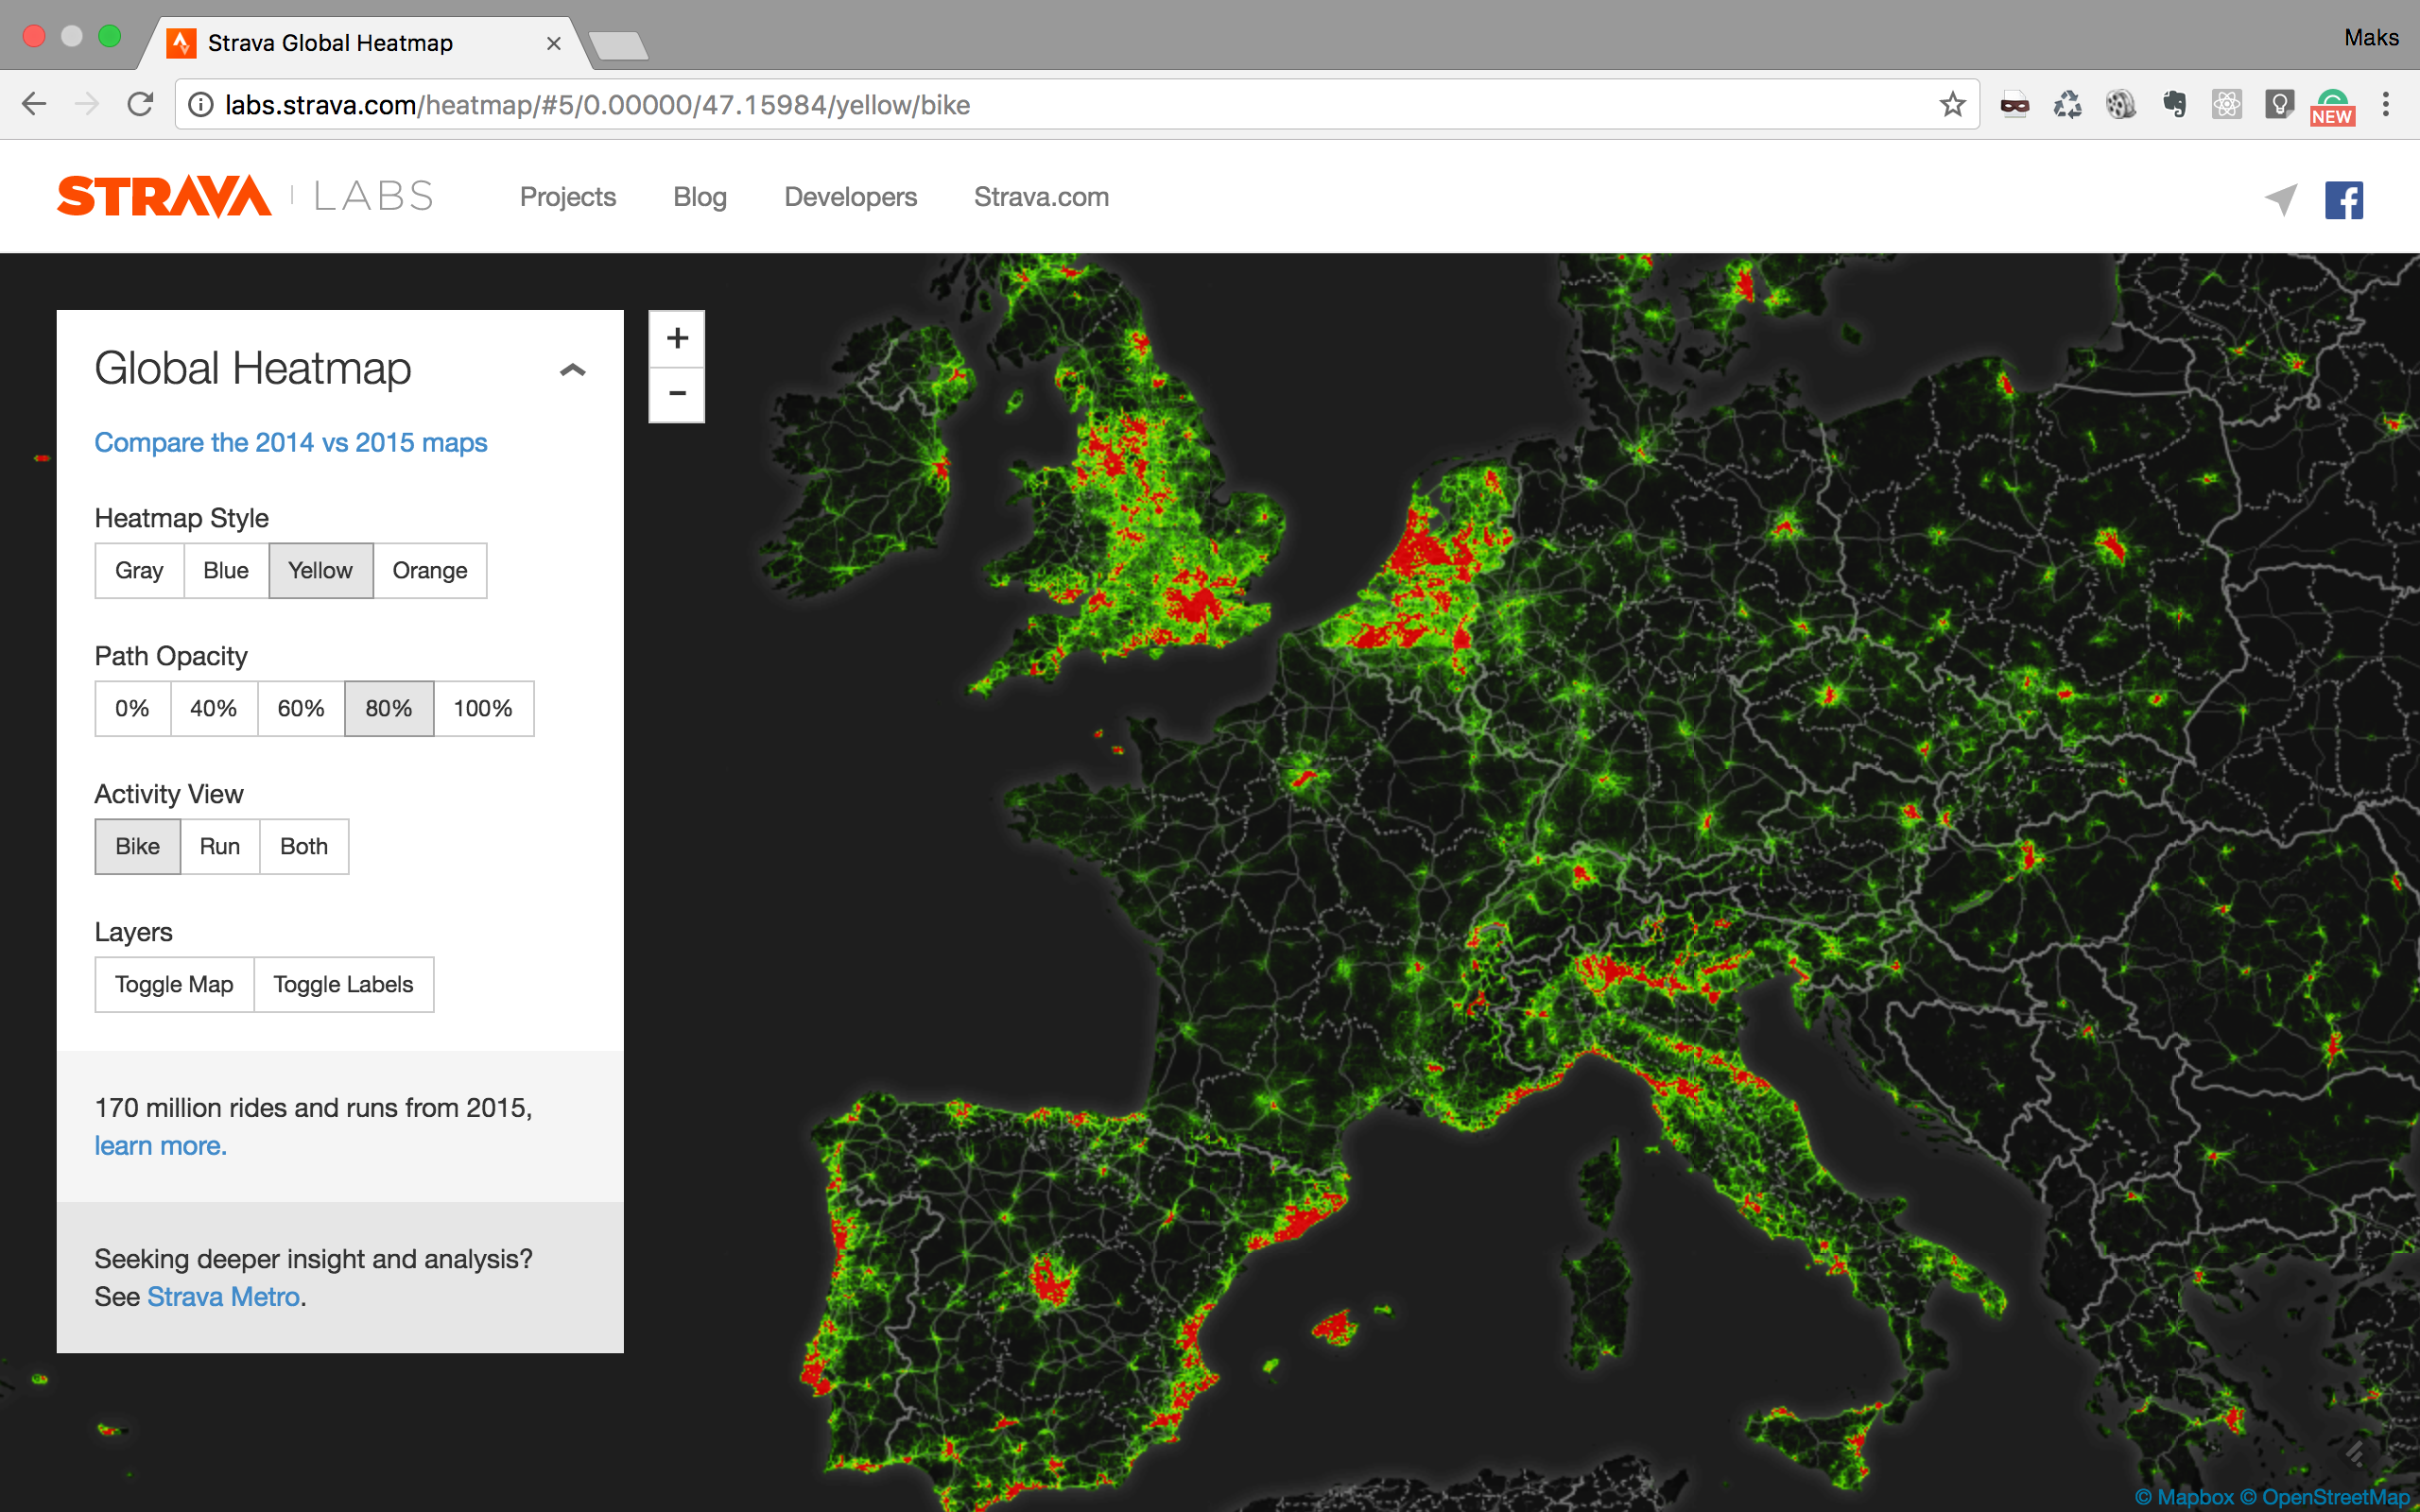
I often use Strava route builder to design my training rides. In combination with Strava heat map, it works magic in finding the most ridden roads everywhere in Europe, be it Spain, Italy or France. Strava will always unambiguously find the way to the Col de Rates, Passo Pordoi or Col du Galibier.
When it comes to the Netherlands and Belgium - the story is completely different. As an exercise, I challenge you to plan a ride from Oudenaarde to the cobbles of Koppenberg or Oude Kwaremont. I bet you will quickly get lost in the mesmerizing mesh of the roads all ever ridden by bicycle.
It all looks very impressive on the zoomed out heat map, but the shear popularity of bicycle as a primary mode of transportation renders Strava heat map completely useless for workout route planning in this part of the world.
Separating Workouts from Commute rides
In order to solve the workout planning problem and give the power of Strava heat map back to Dutch and Belgian people, I’ve teamed up with my good friend and web-maps magician Vova Bilonenko.
Together we’ve created a demo-version of the heat-map for Brussels and Berlin. On the surface we’ve kept everything the same as the Strava service, but behind the scene we’ve set-up clever Artificial Intelligence machinery that analyzes all activities and separates them into Workouts and Commutes.
Toggling a switch will display either all rides or workouts only. For the south of Brussels the result is shown on the animated gif below.
The map becomes considerably cleaner, when only workouts are shown, and the roads left, do represent the crowdsourced wisdom about the best roads to ride on a race-bike for speed, pain and suffering - the holy trinity of the cycling sport.
The actual interactive map can be found here.
How does it work?
The use of term Artificial Intelligence might be an overkill, but it reminds that the output of the classifier must be intuitively understood by the human mind.
What we do in the nutshell is collecting various information about the activities. Among the parameters we deal with are: speed, distance, presence of heart-rate monitor or a power-meter, and whether the ride was labeled as a commute or not.
First we select all rides that are labeled to be a commute and treat them as a ground truth commute.
In order to find the ground truth workout rides we do make an assumption that everyone riding with a power-meter and not labelling the ride as a commute does actually working out. I think it is a fair assumption given the current market price of power-meters.
We have about 10,000 activities from Brussels, 1000 of which are labeled as commute and 500 are considered by us to be workouts. We use this labeled set of activities for training a classifier model.
The trained model allows us to assign labels to the rest of 8000 activities on the map.
Accuracy of our classifier is higher than 85%. The visual representation of our 200 rides validation set is shown below. The results are well in line with what intuition would predict - the short and slow rides are commutes, the long and fast rides are workouts. The only role of the machine learning here is to find the quantitative boundary.
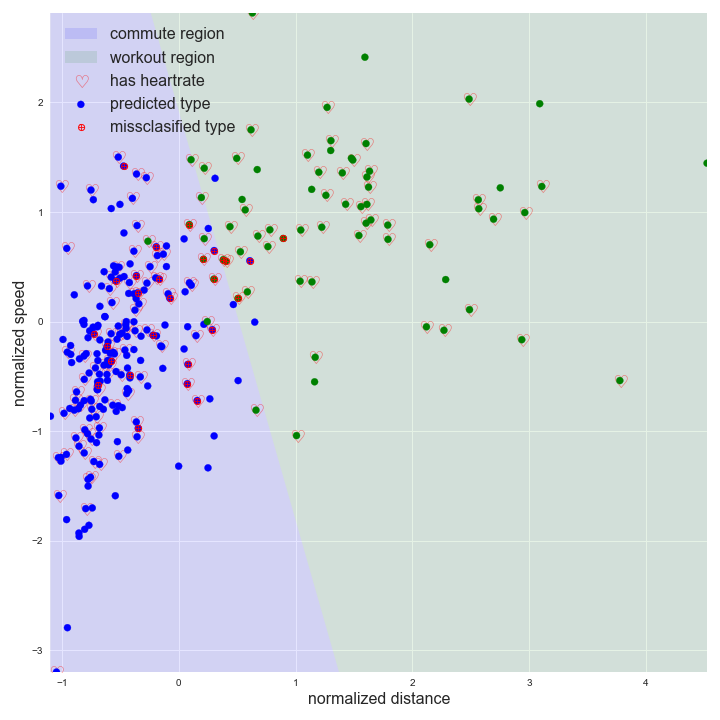
Small remark on the accuracy. If we were at the job of recognizing hand written digits, this accuracy by far would not be enough - we would have only 50% (1-0.85^4) chance of getting the post code right and the post office would never pay us for such lousy performance.
Fortunately we do mapping and missclassifying 15% of the rides will only add some degree of noise to the heat-map, which human mind would easily filter out.
Is there room for improvement?
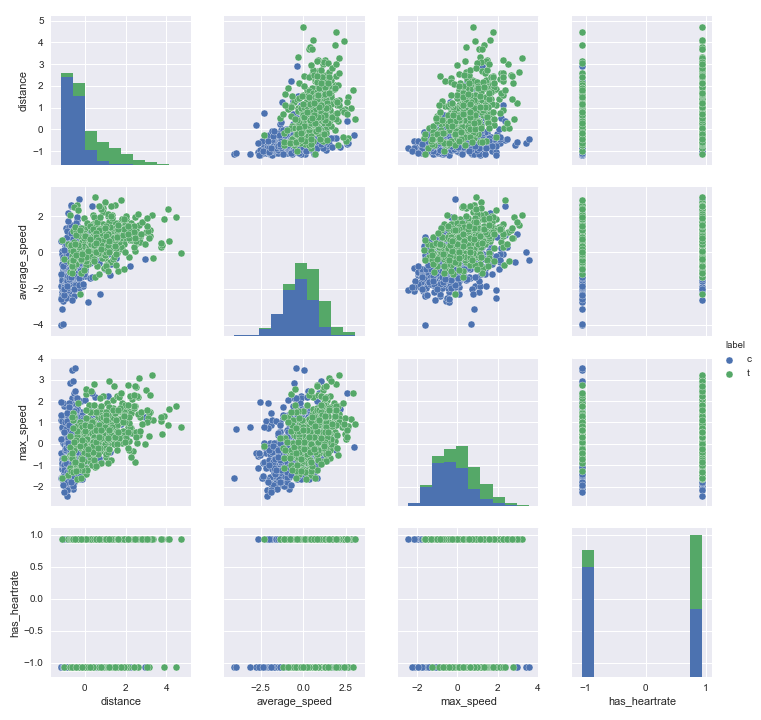
The current classifier is very basic and naive. We do nominally have 4 features to classify upon: distance, average_speed, max_speed and categorical feature has_heartrate.
When looking at the correlation matrix plot it becomes painfully clear that the first three features are strongly correlated and the categorical has_heartrate feature does not provide strong separability between ‘c’ and ‘t’ classes. In other words, out of four features we effectively have maximum two.
Another way to quantify the effective number of features is to perform the Principle Component Analysis transformation of the data set. What this technique does is executing the linear transformation of the original features to order and maximize the variability in the data set along the new transformed features known as components. Quite a mouthful, but think of the line plot on the XY coordinate system. By rotating the axes we can make our line to overlap either with X or with Y rendering another axis obsolete. In other words, we would find a direction of maximum variability.
The results of PCA transformation is shown on the heat-map below. The first component explains about 53% of the variability and consist of predominantly distance, average_speed and max_speed, indicating the strong correlation between these 3 features.
The second component accounts for 23% variability and mainly driven by the categorical has_heartrate feature.
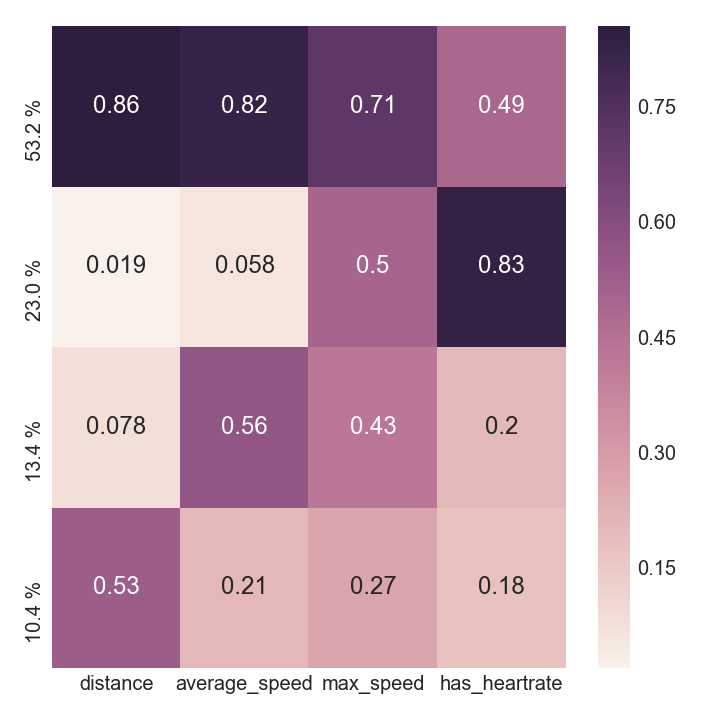
The conclusion after this analysis is that our model lacks independent features. Such features could be found in, to name a few: stop_to_move ratio, time_of_the_day, day_of_the_week etc.
Will it become a full blown service?
It is fair to say that currently this project has a hobby character. For Vova it is an opportunity to exercise his mapping skills, for me - it is an interesting data set to wrangle with. We both work on this project in between having full time job, taking care of small children and, of course, tight cycling training schedule.
The public opinion, however, could make a difference and warm welcome for our efforts would inspire us to get the Smart Strava Routing service live.
Visit the current demo map of Brussels by following this link. Leave your comments with remarks and suggestions down below and spread the world using your social network of choice.