UCI Schleck Gran Fondo in Watts
In what? In Watts - the units of power and the only available cycling metric to objectively report the level of suffering during the bicycle race.
In my previous post I did a quick and dirty job at analyzing average speed and finishing time distribution of Schleck Gran Fondo finishers. That exercise might have told me that I was 20 min or 2.4 kph short of the UCI Granfondo World Championships qualifying performance, but what it means in terms of measurable efforts is a wild guess.
Fortunately many of us do train and race with power meters and I’ve bravely embarked on a quest to find the power numbers of my competitors.
Marrying ChronoRace with Strava
In order to get the power numbers of participants of the Schleck Granfondo I first needed to find all Schleck Granfondo activities on Strava. For that I’ve used the Strava activity search engine.
I’ve requested a list of all activities from the starting village Mondorf-les-Bains and specified that duration of activities must be between 4 and 8 hours, the distance between 150 and 170 km and the elevation gain between 1800 and 2400 m.
The Activity Search is not exactly a public RESTfull API and I had to do a careful parsing of the returned pages in order to extract IDs of activities that match my search criteria. In total I’ve collected about 2000 activity IDs.
The next step was to use the collected IDs to request the activities summary information. This step fortunately relies on the official public Strava API.
With activities information at hand I’ve extracted only records from the date of the Granfondo event. I’ve also focused only on those activities that had power data. In total I’ve ended up with about 100 activities - 10% of the Granfondo participants pool.
With Power numbers from Strava and finishing ranking with time from ChronoRace I was ready to go. With help of python and pandas I did merge 2/3 of the results using names of the riders. For those records, where Strava name did not match the ChronoRace name, I’ve inferred finishing ranking from the average speed using the linear regression fit on the ChronoRace dataset.
Boxplot analysis of Normalized and Maximum power
For power analysis I’ve focused on the Normalized Power and Maximum Power.
The Normalized Power (weighted average power in Strava terms) reports kind of an averaged Power, but with high intensity efforts contributing more to the final results than the low intensity efforts. Essentially it values the moments, when the rider is in red, and underrates, when the rider is slacking in the endurance zone.
Given I have the very limited set of data (only 10% of the total pool) I’ve grouped power data according to the finishing ranking. The lower x-axis shows the ranking groups, e.g. top-100, 100-200 and so on. The upper x-axis shows the finishing timeframe for each group.
The actual power data are plotted as scatters and overlaid with boxplot statistics per group. For those unfamiliar with boxplot - the middle blue line is a median, the upper/lower edges of the box are the 25% and 75% quartiles respectively, the whiskers are the statistically relevant extrema. Basically it is a clever way to show not only the mean values, but also the spread in underlying data.
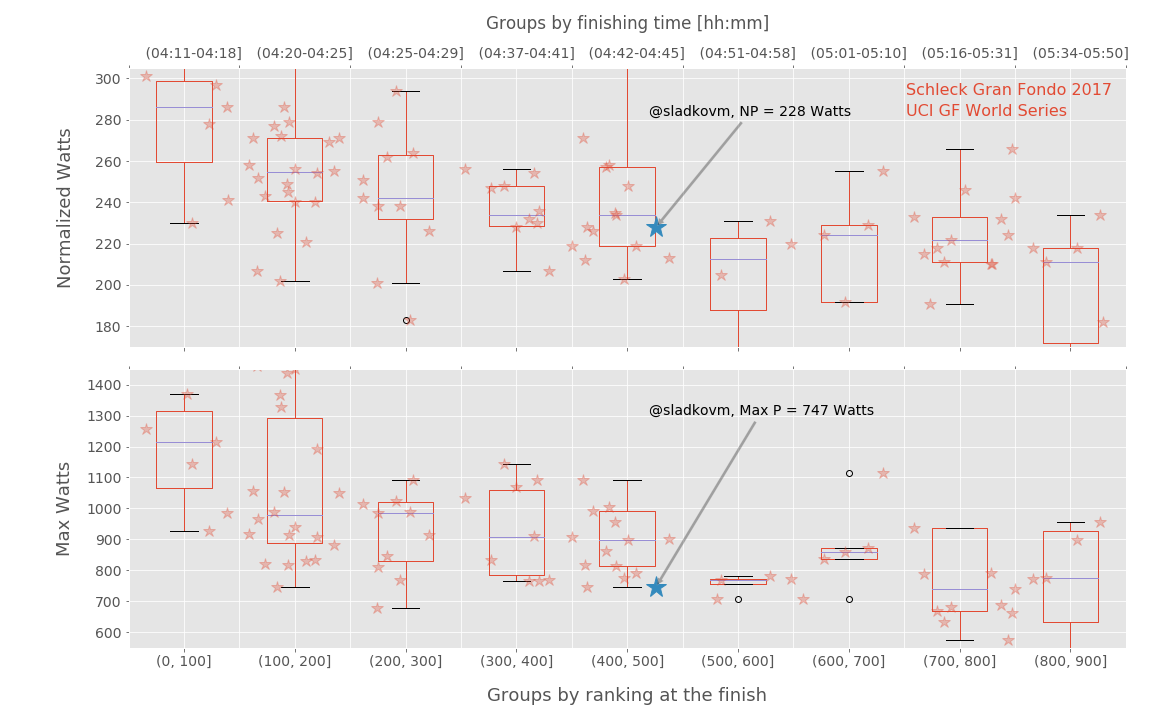
Miles away from the top-100
Now comes the hard truth. In order to finish in top-100 one needs to be able to sustain 280-300 Watts of Normalized Power for more than 4 hours. To make it more scary - it is almost a half of the horsepower. The sprinting power must also be there and well in excess of 1000 Watts.
Normalized power numbers do drop, more down the ranking we go, and flatten at around top-400 at 230 Watts. My placement at the finish was 476 with 228 Watts and, with a bit of luck, I might have made it to the top-400. Anything in the top-300 would be a very hard ask from me.
It is interesting to note that the high max efforts are only present in the top-100 group. When you are not in the category of the riders fighting for podium, it probably makes no sense to sprint to the line.
Another useful metric to analyze would be a power per weight ratio, but here I’m out of luck. In order to protect the riders privacy, Strava returns only very brief summary of the requested activities. Therefore, without explicit authorization from the user, the third party applications (me in this case) can not request weight, ftp and other sensitive information.