The value of gold at La Marmotte des Alpes
La Marmotte des Alpes is arguably the biggest amateur cycling event in France. Starting in the Bourg d’Osains - the capital of French cycling, this cyclosportive covers distance of 175 km and conquers on it’s way the spicy Col du Glandon, the mighty Col du Galibier and offers the finish up the famous slopes of the Alpe d’Huez. Total elevation gain is more than 5000 meters.
Gold, Silver and Bronze
Riding up the Col du Galibier is already a heroic effort. In fact, every marmot in the area knows, that the Galibier is endless, and the only reason the Strava data exist is because GPS trackers do run out of charge.
On a serious note, La Marmotte has time-cuts and, depending on the finishing time, the riders would be awarded with gold, silver and bronze performances.
For most of the riders, the gold performance is the ultimate goal.
Recursive tree activities search
By now I have already a developed pipeline for analyzing granfondo races. First - parse official race results, second - find related activities using the Strava Activities Search engine and, finally, fetch the activities details using the public Strava API.
What I’ve discovered with such massive event as La Marmotte is that the activities search simply fails under the shear number of rides around the Bourg d’Osains.
I’ve solved this problem by implementing the recursive tree-search algorithm around the Strava Activity Search engine.
The recursive approach allows automatic drill down of the search parameters vector until the desired depth is reached. Essentially I can even request activities with depth defined by resolution of 1 sec for duration and 1 meter for distance and elevation gain.
Running the maximum depth recursive search around Bourg d’Osains would take more than a day on my laptop, therefore I’ve limited the search criteria to 100 m elevation and distance resolution.
In total I’ve accumulated 6291 records from the event ranking page and 1281 records from Strava, 235 of which had power data.
No sprinting! Never, ever!
As in the previous analysis I was interested in knowing the distribution of the finishing time and the trends in normalized power.
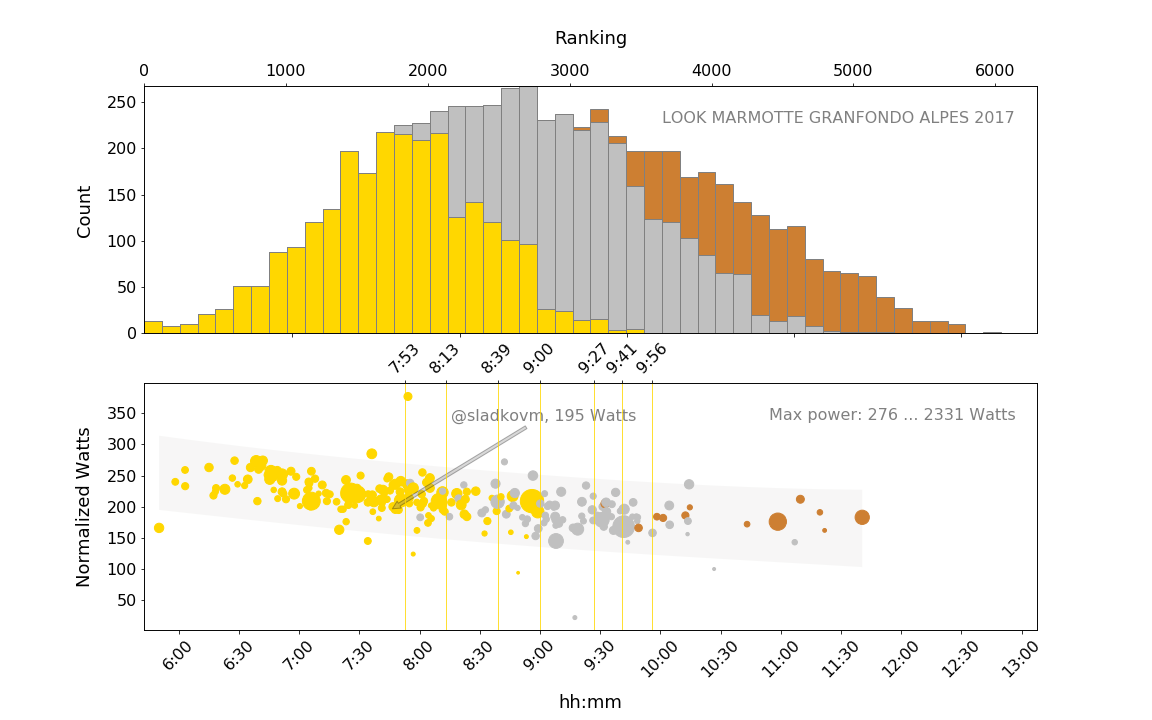
This time I also grouped the results according to the medal earned and coded it into graphs as gold, silver and bronze respectively.
The boundaries between different medals distributions are soft due to the fact that the time-cuts are different for each age category. I’ve shown the time-cuts for gold performance as vertical grid lines.
The power data are color coded using the medals color, while the size of each scatter point represents the maximum a.k.a. sprinting power. The grey-shaded band behind the scatters represents the prediction intervals calculated using power-time regression model.
All in all, the normalized power results are within the reasonable expectations. The top riders can sustain 250 Watts over 6 hours ride, while the average riders like me would do around 200 Watts. Both these performances are sufficient for a gold medal. Details of my ride can be found on Strava.
What I found remarkable is that top-1000 riders very sparingly use their sprinting power (the size of scatters is small) and I think all of us can learn a lesson here. For every surge into red you will pay dearly during the long climbs.